LIGO Document G1700908-v9
- Once a gravitational wave signal has been identified in the LIGO data, the next step is to measure the properties of the system. This is done by comparing the signal to millions of different waveforms predicted by general relativity and seeing which match the data. The animation illustrates how this sort of comparison can work for two of the properties of the first gravitational wave detection, GW150914: the total mass of the two black holes, and the distance of the binary from Earth.
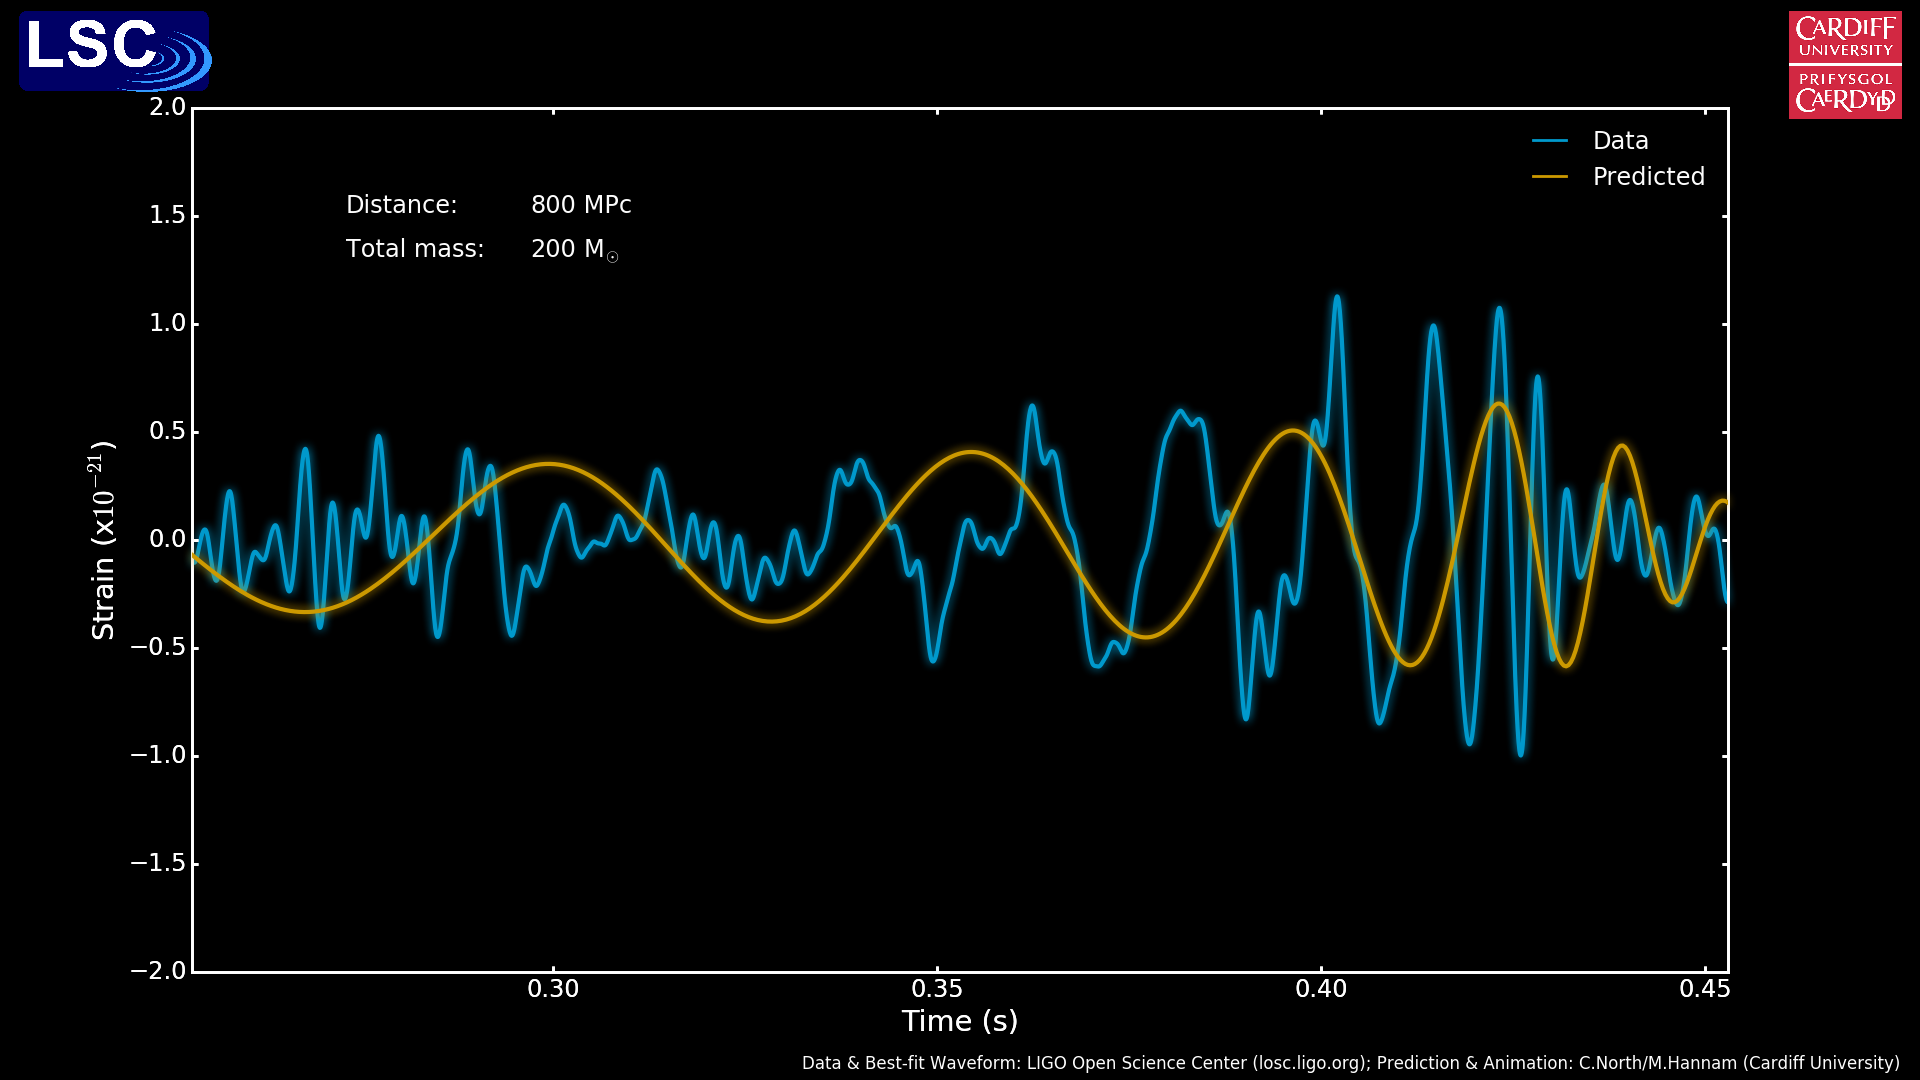
The graph shows the strain (the relative stretching and squeezing of space) caused by gravitational waves as they were detected by LIGO over a period of about 0.2 seconds. To simplify this animation we assume that the signal was produced by two black holes, each with the same mass, and not spinning, as they spiral together and merge. For the predicted signal we start with a guess of 200 solar masses for the total mass of the binary, and a distance of 800 Mpc (about 2.5 billion light years) from Earth.
In a binary black hole merger, the duration of the signal scales with the total mass of the system; if the two black holes are twice as massive, the signal will last half as long. The mass also affects the amplitude of the signal. This means that we can easily stretch or shrink our predicted waveform with different guesses of the total mass, until we get the best agreement with the data.
The strength of the signal scales with its distance from us; if the binary is twice as far away, the gravitational-wave signal would be half as strong. We can now magnify the predicted signal for different guesses of the distance.
We find the best agreement for a total mass of 65 solar masses, at a distance of 420 Mpc (about 1.4 billion light years).
The final phase of the animation shows what happens when the effects of the detector sensitivity are applied to the predicted signal, just as they already are to the plotted data. Since the detector is most sensitive to frequencies of around 100-300Hz, and less sensitive to 30Hz and below, the lower frequencies (seen at earlier times) are filtered out.
This simple illustration ignores many other effects. For example, the signal strength also depends on how the binary's orbit is inclined, and the shape of the waveform depends on the difference between the two masses, and whether the black holes are spinning. There are also scaling effects caused by the redshift of the gravitational waves which are ignored in this animation.
To include all of the effects on the signal, we need not just one waveform that is stretched and magnified, but theoretical waveforms for all possible configurations of black holes. A sophisticated computer code is used to efficiently identify the range of theoretical waveforms that agree best with the data. When that is done for GW150914, the masses of the black holes are 29 and 36 solar masses (which is close to being equal), and the signal does not show strong signs of spin. That is why this example waveform can be lined up so accurately with the data.
For a description of the full analysis of the properties of GW150914 see the LIGO Science Summary at http://www.ligo.org/science/Publication-GW150914Astro/index.php
For access to the LIGO data and the best-fit numerical simulations, along with tutorials for downloading and analysing the data, visit the LIGO Open Science Center at https://losc.ligo.org/events/GW150914/
- [v9 updated to include amplitude scaling in mass effect
DCC Version 3.5.4.3, contact
DCC Help